
⛳ Tambora, Sumbawa is situated in or near the subtropical wet forest biome.
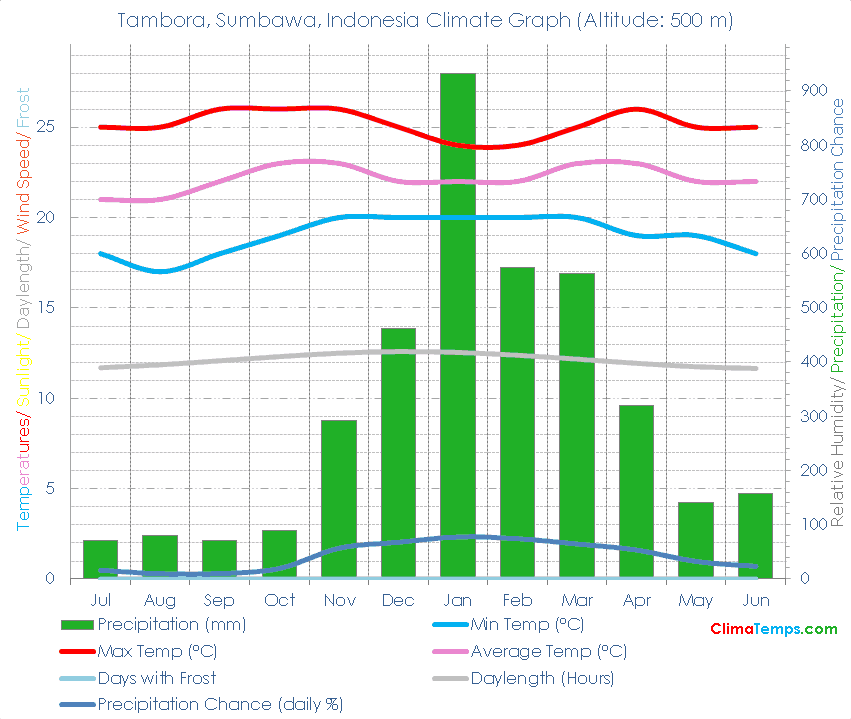
🌡️ The annual mean temperature is 22.2 degrees Celsius (71.9 degrees Fahrenheit). See the temperatures page for a monthly breakdown and the fixed scale graph.
🐬 Average monthly temperatures vary by 2 °C (3.6°F). This indicates that the continentality type is hyperoceanic, subtype extremely hyperoceanic.
☔ Total annual precipitation averages 3752 mm (147.7 inches) which is equivalent to 3752 Litres/m² (92.03 Gallons/ft²).
Simply paste the following HTML code into your webpage. Please include a link back to this website. There is one in the following code already. Edit the width attribute to change the size of the graph if needed:
✨ The longest day of the year is 12:28 long on the 21 of December and the shortest day is 11:31 long on the 22 of June.
🐇Were you to burrow down through the centre of the Earth from Tambora, Sumbawa you would pop up nearest to the climate station at Tumeremo, Venezuela where you would find a Tropical wet and dry/ savanna climate (Subtropical moist forest biome).
🌍Tambora, Sumbawa, Indonesia is at 8°12'S, 117°49'E, 500 m (1640 ft). Check the location on the map.
| Climate Variable | Jul | Aug | Sep | Oct | Nov | Dec | Jan | Feb | Mar | Apr | May | Jun | Annual | ||
|---|---|---|---|---|---|---|---|---|---|---|---|---|---|---|---|
| Average Max Temperature °C ( °F) | 25 (77) | 25 (77) | 26 (79) | 26 (79) | 26 (79) | 25 (77) | 24 (75) | 24 (75) | 25 (77) | 26 (79) | 25 (77) | 25 (77) | 25 (77) | ||
| Average Temperature °C ( °F) | 21 (70) | 21 (70) | 22 (72) | 23 (73) | 23 (73) | 22 (72) | 22 (72) | 22 (72) | 23 (73) | 23 (73) | 22 (72) | 22 (72) | 22 (72) | ||
| Average Min Temperature °C ( °F) | 18 (64) | 17 (63) | 18 (64) | 19 (66) | 20 (68) | 20 (68) | 20 (68) | 20 (68) | 20 (68) | 19 (66) | 19 (66) | 18 (64) | 19 (66) | ||
| Average Precipitation mm (in) | 71 (3) | 79 (3) | 71 (3) | 89 (4) | 292 (11) | 462 (18) | 932 (37) | 574 (23) | 564 (22) | 320 (13) | 140 (6) | 158 (6) | 3752 (148) | ||
| Number of Wet Days (probability of rain on a day %) | 5 (16) | 3 (10) | 3 (10) | 6 (19) | 17 (57) | 21 (68) | 24 (77) | 21 (74) | 20 (65) | 16 (53) | 10 (32) | 7 (23) | 153 (42) | ||
| Average Daylight Hours/ Day | 11h 41' | 11h 51' | 12h 04' | 12h 18' | 12h 29' | 12h 35' | 12h 32' | 12h 22' | 12h 09' | 11h 56' | 11h 44' | 11h 38' | 12h 00' | ||
| Sun altitude at solar noon on the 21st day (°). | 61.3 | 69.6 | 80.9 | 85.5 | 77.8 | 74.8 | 78 | 85.9 | 81.4 | 70 | 61.6 | 58.4 | 73.7 |
Please take a moment to share a climate graph or simply the address:
Thank You, so much! ❤️